
TechExpert offers comprehensive services for building business intelligence systems that will allow you to effectively analyze and use the data available in your company for both operational and strategic management.
A well-prepared database, extensive data analysis capabilities and convenient administration make it possible to quickly generate reports from large amounts of data, quickly and easily change their appearance without the involvement of IT specialists.
The business intelligence system will solve a number of urgent tasks:
- Visual and flexible work with data
- Efficient and comprehensive use of big data
- Prompt decision-making based on data from disparate systems
- The ability to quickly respond to changing situations and find the causes of such changes
Using the most advanced analytical reporting technologies allows our specialists to build systems of any complexity for different categories of specialists: from corporate reporting at the level of the entire company to personal analytics at the level of an ordinary employee or department.
Microsoft products used:
- Microsoft Windows Server
- Microsoft SQL Server
- Microsoft SharePoint
- Microsoft Power BI
- MS Excel and MS SharePoint components: Power Query, Power Pivot, Power View, Power Map
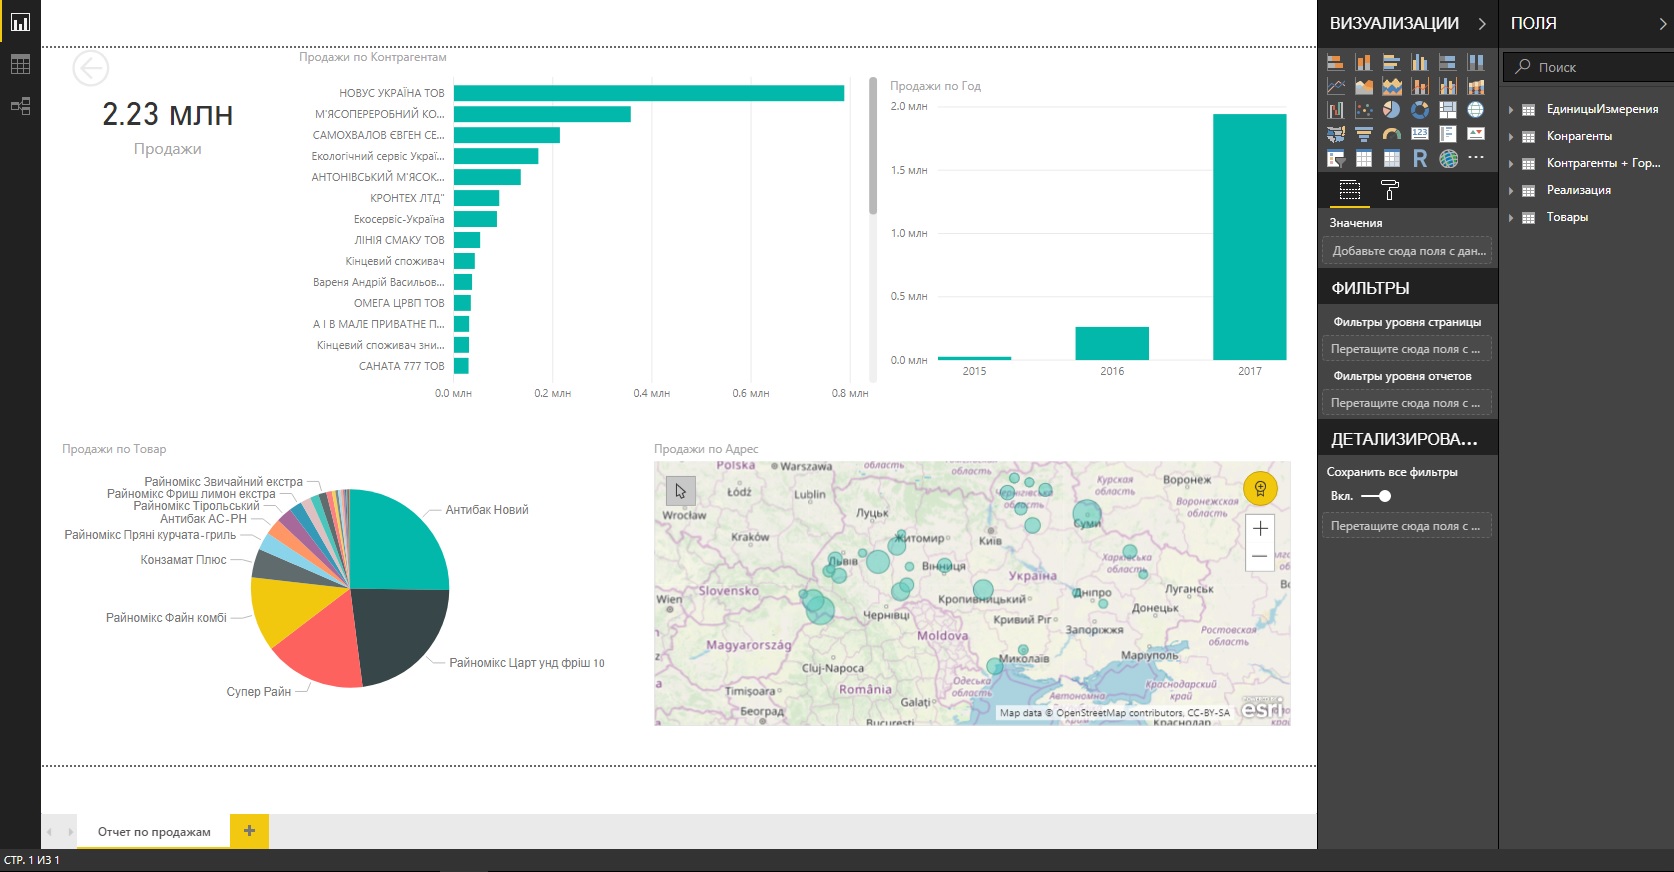
Cloud service for analytics from TechExpert — sales reports from your 1C
The solution allows you to use cloud computing power for analytics to generate reports on sales results from your 1C database.
Would you like to receive reports on daily, monthly, quarterly or annual sales results?
Do you want to compare it with your plans?
Deep analytics in the context of goods, counterparties, various periods.
And all this in the form of visual graphs and diagrams.
Stages of implementing a business intelligence system
We provide a full range of services for building business intelligence systems: from optimizing business processes and introducing new KPIs to comprehensive data processing, building analytical models and visualizing indicative indicators.
Learn more about the stages of implementing a business intelligence system
| Stage | Description |
|---|---|
 |
Analysis of the current situation in the company in relation to business intelligence needs and development of system requirements. Pre-project survey, including:
|
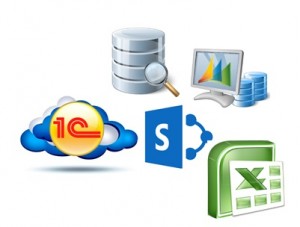 |
Identification of key data sources:
|
 |
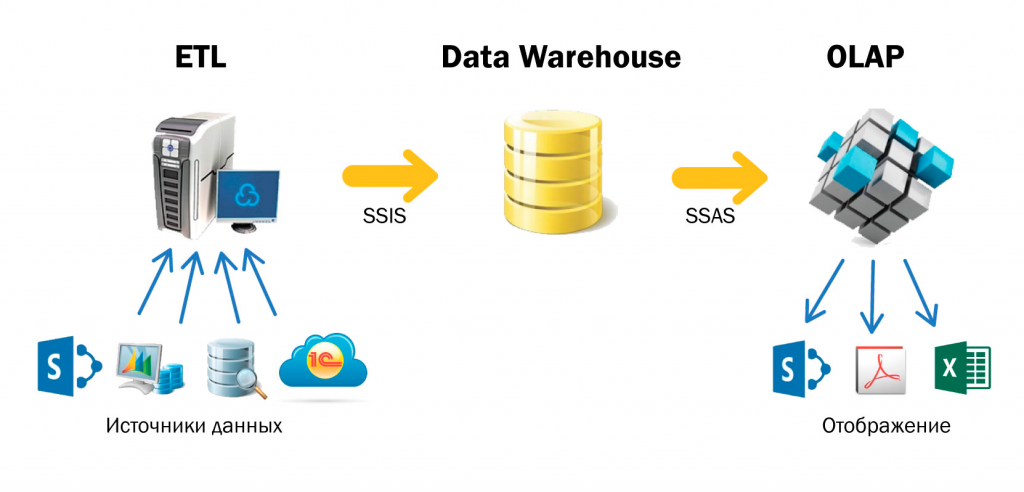
Creation of an integration mechanism (ETL). Extract, transform and load data into storage:
|
 |
Building a data mart. Building an analytical data model (OLAP cubes):
|
 |
Visualization. Building reports based on the generated data model (Power View, Power Map, SharePoint):
|
Business Intelligence Benefits
Ability to use different tools depending on the task
- Tools for self-service business intelligence and information visualization
- Dashboards — for easy creation and sharing
- Reports of any degree of complexity, access to tables of several million rows with information analysis in RAM
Transparency and integration with various systems
- Full integration of various data sources and applications, thanks to this – a single picture of the situation in the organization
- Transparency and integration with corporate systems
- Track issues and opportunities in real time
- Opportunity for detailed analytics and immersion in data sources
Deep analysis of business information
- Deep business metrics platform and decision-making platform
- More opportunities for visualization and interactive interaction with information
- The ability to flexibly configure both the indicators themselves and analytical reports
- Improved API, wide opportunities for development and integration

Business benefits from the solution
- enterprise-wide analytics
- the ability to make informed decisions in order to reduce the cost of production, sales, logistics, as well as increase the efficiency of operations
- increasing of the capitalization of the enterprise and protecting existing investments
- reduce the number of instinctively made decisions
- minimize errors in the study of data and the amount of routine work
- quick and timely responses for business, for a more flexible response to market changes
Depending on the real needs of the customer, our company will select the optimal set of tools and build exactly the online business intelligence system that best suits your business interests.
Project implementation timeline
From 1.5 to 7 months depending on the complexity of the project, the availability of clear requirements, the described data.